The Cluster Manager (Dashboard module) shows the health and capacity of the compute cluster that runs IntraLLM. Administrators use it daily to confirm everything is healthy and to act before small issues become outages.
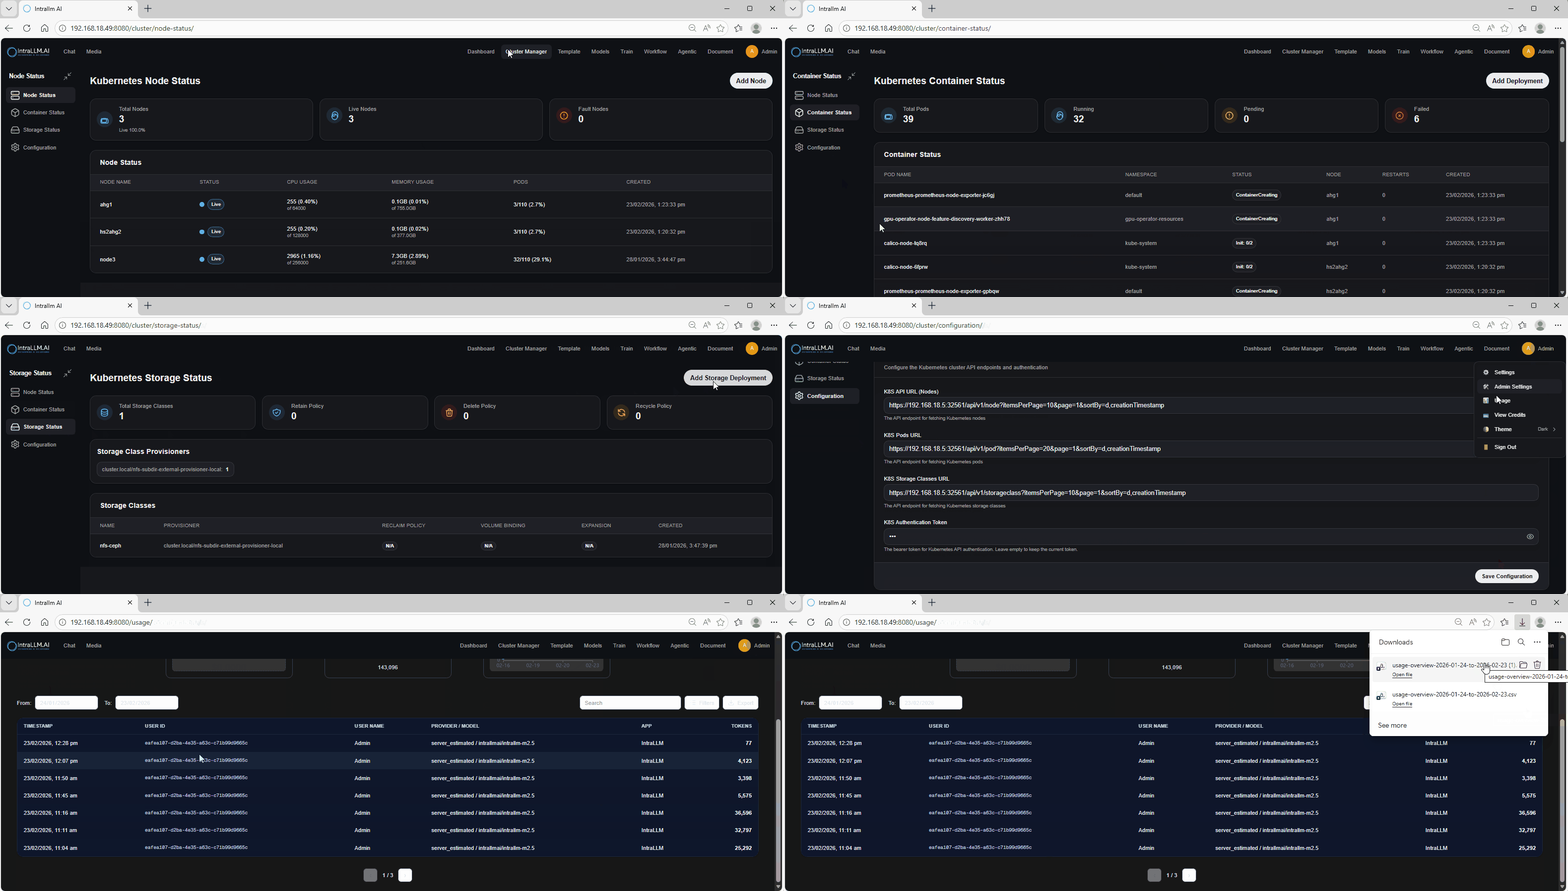
Areas of the Cluster Manager
Node Status
A row per cluster node with the essentials at a glance:
| Column | Meaning |
|---|---|
| Node name | Identifier of the node/cluster. |
| Status | Operational state (ready, not ready, etc.). |
| CPU usage | Capacity vs current use. |
| Memory usage | Capacity vs current use. |
| Pods | Number of running workload units on the node. |
| Created | When the node joined the cluster. |
Use it to: spot overloaded or offline nodes early, and to see where workloads are concentrated.
Container Status
The list of platform workloads (containers/pods) and their state:
- Refresh the view of namespaces and workloads at any time.
- Update/restart a pod — the standard first-line recovery for a misbehaving service.
- Delete a pod — remove a workload unit; healthy deployments recreate it automatically.
- Error banners appear at the top when status cannot be fetched — usually a connectivity or permissions issue to investigate before acting on the data.
Storage Status
Shows storage attached to the cluster — volumes/capacity and how full they are. Model files, documents and generated media consume this space; watch it alongside Fine-Tuning checkpoints and media downloads.
Configuration
Cluster connection and membership settings:
- Connection details for the cluster management interface, including a link to open the cluster web console where enabled.
- Add a node — generates a join command to run on the new server to attach it to the cluster. Copy and hand it to your infrastructure team.
- Deployment controls such as scale up/resume when a deployment was scaled down.
Treat these as production controls:
Restarting pods, deleting workloads and adding nodes change live behaviour. Follow your change-management process, and involve the IntraLLM support team if unsure — especially on production clusters.
Daily routine for administrators
- Glance at Node Status — all ready, usage below your warning thresholds.
- Check Storage Status — no volume above ~80%.
- Scan Container Status — everything running as expected.
- Review GPU Monitoring — model serving capacity. See GPU Monitoring.
Notes
- Data refreshes on view/update; use the refresh controls after making changes.
- Visibility and actions follow administrator permissions.
- Cluster Manager complements — not replaces — your enterprise infrastructure tooling for deep scaling and network configuration.