Usage
The Usage page provides visibility into how IntraLLM models and services are being used over time. It helps users and administrators understand consumption patterns, activity levels, and overall platform usage.
Overview
Usage data is presented through summary metrics, charts, and a detailed activity table. This information can be used for monitoring, optimisation, and auditing purposes.
Usage Metrics
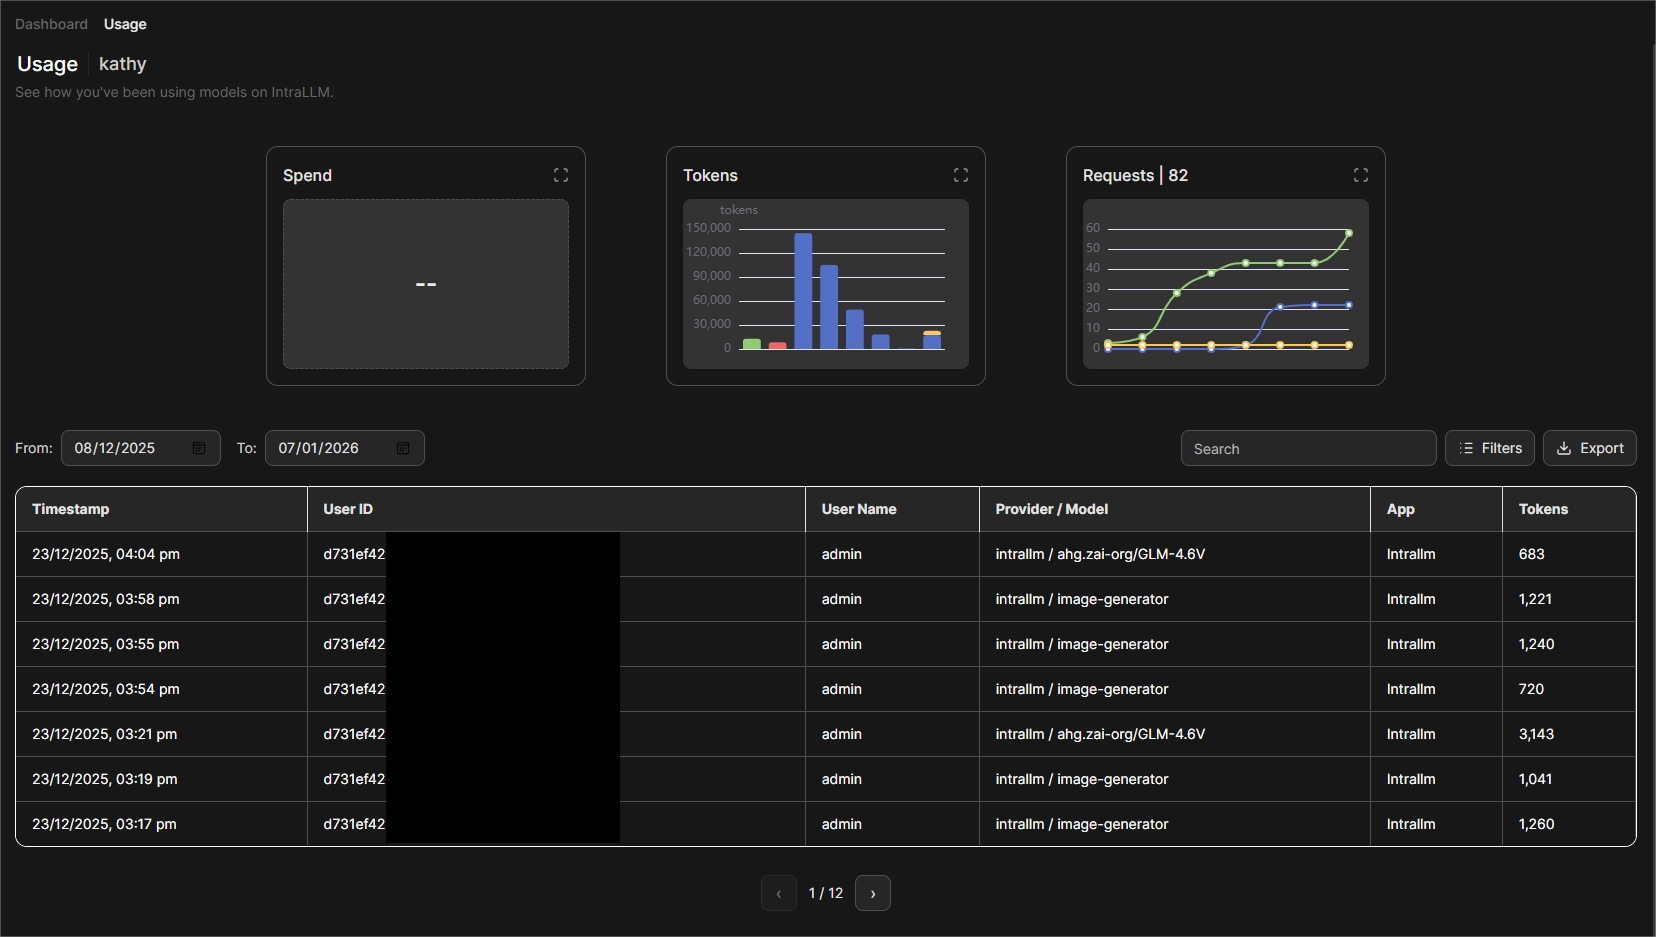
Spend
The Spend chart displays estimated usage cost over the selected time period. It provides a high-level view of how consumption changes over time.
Tokens
The Tokens chart shows the number of tokens consumed by each model. This helps identify:
- High-usage periods
- Models or applications with heavy token usage
- Overall workload intensity
Requests
The Requests chart displays the total number of requests made to models and services by each user. It is useful for understanding traffic volume and usage frequency.
Time Range Selection
You can filter usage data by selecting a From and To date range. All charts and tables update automatically based on the selected period.
Detailed Usage Table
Below the charts, a detailed table lists individual usage records, including:
- Timestamp
- User ID
- User name
- Provider / Model
- Application
- Tokens used
The table supports searching, filtering, and exporting data for further analysis.
Exporting Data
Usage records can be exported for reporting or offline review. Exported data reflects the current filters and selected time range.
Notes
- Usage data is read-only and intended for monitoring and analysis.
- Visibility of usage details may depend on user role and permissions.
- Charts provide aggregated views, while the table shows request-level detail.
This page helps track how IntraLLM resources are consumed and supports informed decisions around capacity planning and optimisation.